During the 1928 presidential campaign, Herbert Hoover famously promised that in addition to “a chicken in every pot,” there would also be “a car in every driveway.” That would have been a neat trick back then, even without the Depression: at the time there were 21 million cars and 57 million driveways. Yet as we know, cars eventually caught up with driveways.
Pools, however, seem to be on a different course. True, the percent of single-family homes with inground pools has increased from 2 percent in 1970 to 6.8 percent today. But it should be remembered that the pool industry was very nascent in 1970. If you look at household penetration just since 2010, the inground base has actually shrunk 0.2 points (when accounting for depletion).
But the story gets much more interesting when the focus shifts to new construction.
STATE LEVEL
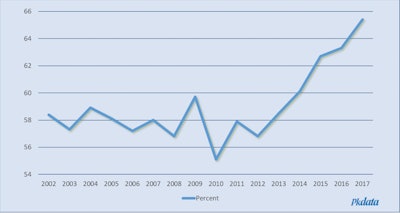
Most people in this industry are keenly aware that just four states comprise the majority of new residential inground pool construction. Collectively, Florida, California, Texas, and Arizona represented 65.4 percent of new pools in 2017. The percentage keeps getting higher.
 Fig. 1: Percent of total U.S. new residential inground pools that were built in Florida, California, Texas and Arizona, 2002-2017. Source: Pkdata.
You would be right to point out that the four states have also experienced significant population increases. But much of that growth has come from the lower income strata. Median income (relative to the rest of the U.S.) has declined in all four states since 2002.
 Fig. 2: Median household income by state as a percent of U.S. median household income, 2002 and 2017. Source: U.S. Census Bureau.
MARKET LEVEL
Pool sales remain quite concentrated when we shift to the market level. All but one of the top ten Designated Market Areas for pool construction in 2017 were in the big four states. New York appears because its metro area is very populous and, as a DMA, it also encompasses a large surrounding area including Rockland and Westchester counties, Long Island, and part of northern New Jersey.
 Fig. 3: Percentage of total new residential inground pools by Designated Market Area, 2002 and 2017. Source: Pkdata.
In 2002, the top 10 DMA’s accounted for 48.3 percent of all new residential inground pools. Today the top 10 are now 50.5 percent of new pools. Moreover, note how the rankings have shifted. It is clear that Florida is assuming an ever-greater portion of the new construction activity. New pools in Florida now account for 29.5 percent of the total U.S., up from 20.6 percent in 2002. Blame the recession for some of that shift as fewer home builders throughout the Sunbelt are including pools in their spec homes.
PERMIT LEVEL
 Fig. 4: Percentage of total new residential inground pools by Designated Market Area, ranked, 2002 and 2017. Source: Pkdata.
To put a fine point on how concentrated the pool business is, consider this: We estimate that there are about 14,400 jurisdictions with construction permitting agencies including municipalities and unincorporated counties throughout the country. Based on Pkdata’s pool permits analysis, the top 31 jurisdictions, or 0.2 percent , accounted for 21.4 percent of all residential inground pools in 2017.
We have long maintained that the pre-recession runup in pool construction was based on a broader economic bubble and that we are unlikely to see those sales levels again any time soon. But we also share everyone’s dismay that the post-recession recovery has been so muted – 4.1 percent average annual growth since 2010 – while so many comparable segments have flourished.
Want More Data?To learn more about the pool industry, check out Pkdata's 12th annual U.S. Residential Swimming Pool Market Report, which features detailed analysis of all aspects of the residential inground and aboveground pool business. To learn more, click here. |
That’s why this increasing concentration of pool builds is so worrisome. Our permit data shows that the industry is selling 21.4 percent of new pools within an area representing 15.2 percent of households. If the industry is to get back on a growth track comparable to similar businesses, then new trails need to be blazed. And soon.
Pkdata is an Atlanta market research firm that has tracked the residential and commercial pool and spa industry since 1992. To date the firm has completed over 400 studies among consumers, manufacturers, dealers, builders and service companies. Its annual industry statistics reports are widely used as planning tools by principal stakeholders globally.


![IPSSA’s incoming President Michael Denham [left], Rose Smoot, IPSSA Executive Director [center] and the outgoing President, Todd Starner [right].](https://img.aquamagazine.com/files/base/abmedia/all/image/2024/04/New_IncomingPres_MikeDenham_RoseSmoot_outgoing_president_ToddStarner_IMG_3920_copy.662682e0cbd3a.png?auto=format%2Ccompress&fit=crop&h=112&q=70&rect=0%2C345%2C3024%2C1701&w=112)


