Anyone who has raised children remembers the familiar refrain. No more than an hour into any road trip, there comes a small voice from the back of the car: "Are we there yet?" Which is shortly followed by, "How soon before we get to (Grandma's house, the lake, Disney World, etc.)?"
I still hear that a lot. Not from my children, who are grown and on their own. No, today those plaintiff calls are from pool industry stakeholders asking if this is the year the business returns to those halcyon days of 170,000 pools a year.
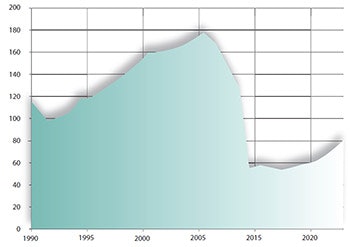 CHART 1: New inground residential pool construction, 1990-2017. Source: Pkdata.
Sorry kids — we still have a ways to go yet.
If you refer to Chart 1 (left), you'll see that our journey begins in 1991, the start of the longest sustained annual sales increase in the history of pool building. Over a 15-year period, pool construction rose from 97,000 pools that year to 176,000 in 2005. And then came the perilous nosedive that ended in a nearly 70 percent decline, to 54,000 pools, in just three years — all thanks to the Great Recession.
One wonders how things might have been had it not been for the bottom falling out of the economy and its consequences on almost all industries — including pools. Yet most economists think the downturn was the inevitable result of a housing bubble built on increasingly frail financial underpinnings.
RELATED: Pkdata on Pool Service: Good News and Bad News
Lately, however, the pool industry has begun to show new signs of life. In fact, if you compare the slope of the recent inground pool sales curve from 2012 until 2017, it does look very similar to the run-up that started in 1991.
 CHART 2: New inground residential pool construction, 1990-2017, 2012-2017 growth superimposed (in red). Source: Pkdata.
Could history be repeating itself? Probably not.
For one thing, I would argue that the pool construction industry doesn't have the infrastructure it had back in the 1990s. For example, look at how new pool sales have grown over the very long term going back to 1970 (See Chart 3).
Notice the trend line (red dashes). If it hadn't been for the recessions of the early 1980s, early 1990s and the slight downturn before the runup in the early 2000s, the pool category would have had extraordinarily consistent growth for 35 years.
During that time, the industry made the transition from its formative years in the '50s and '60s to the onset of a multi-billion business. Still, with such a precipitous drop from 2005-2008, and the relatively slow recovery since, you must wonder how much of that 35-year growth was "natural" and how much was simply the result of coat-tailing the housing bubble?
Time will tell, of course, and there is no way to know until then. But here is one hypothesis.
A key measure of any industry is the extent to which it has become "mature." When we get calls from prospective investors, the question always arises: Is the pool industry mature? Companies in mature industries usually exhibit lower organic growth and reduced earnings than firms in emerging sectors.
 CHART 3: New inground residential pool construction, 1970-2017. Source: Pkdata.
One of the tests we apply to maturation within the pool segment is comparing new pool construction against the base of qualified single-family homes. (We choose single-family homes because not many people living in an apartment, condo or mobile home are likely to build a new inground pool. And by "qualified," we mean families with annual incomes of $100,000 or more who do not already have a pool.)
Chart 4 shows the growth of new pools relative to the base of qualified single-family homes since 1970. The curve looks very similar to the previous graphs because the total stock of SFH's has changed only gradually. Again, the curve has oscillated considerably over the years, primarily in response to the underlying economy. But notice the trend line (red dash) and how, like the graph in Chart 3, the curve always seems to come back to that line. As you can see, the value of the trend line is almost exactly 1.0 percent.
So, here's the hypothesis: The "natural" market for new inground residential swimming pools in the U.S. is ±1.0 percent of qualified single-family homes. In 2017, the total number of U.S. single-family homes was 11.7 million, and 1 percent of that is about 120,000. Yet the total sales for last year was 75,000 — a welcome improvement over the rate of post-recession recovery, to be sure. But it is still well below both the long-term average of 98,000 (since 1970) and even further below what we are now calling the natural market.
Let's assume that our hypothesis is correct and that the natural market is really 1 percent of single-family homes. How soon before we get there?
 CHART 4: New inground residential pool construction as a percentage of total qualified single- family homes (%). Source: U.S. Census Bureau; Pkdata.
The short answer: 2024.
The long answer: In Chart 5, we are assuming that the pool industry will continue to grow at the same 7.2 percent rate it has enjoyed since 2012 (start of the new growth curve, remember?). We are further assuming that single-family homes will increase by their average rate since 1970, about 0.85 percent per year. The blue line in the chart is the projected SFH growth based on that average. Where they finally merge, the magic 1 percent mark, is right at 124,000 pools.
I think most people would be reasonably happy with 124,000 pools. It's not where the industry was in 2005, but it's a lot better than where it was in 2009.
RELATED: Does the Future Hold 25 Million New Pools?
Another reason why I think 1 percent is a natural state is because of what I refer to as the infrastructure question. During the run-up from 1991-2005, the pool business went from 6.0 percent above the natural market to 55.1 percent. Part of what constrains growth in a construction-driven business like new pools is something called capacity. This means things like capital investment in construction equipment and rolling stock, increases in selling and administrative costs and, especially pertinent for our industry, recruiting and retaining installation crews. A lot of companies somehow rode the economic updraft by securing new working capital any way that they could.
 CHART 5: Projecting inground residential pool construction against expected growth in single- family homes, 1970-2024. Source: U.S. Census Bureau; Pkdata.
And then the party ended. In 2005, we estimate that there were nearly 10,000 pool companies in the U.S. Three years later, almost a quarter of them were gone.
I attended an industry conference in 2010 and spoke with several of the larger builders in the United States. With the benefit of a lot of hindsight, almost all of them said they would not repeat their financial mistakes again. Today, those companies that did survive are in a much stronger position. They have cleaned up their balance sheets. Many of them have diversified into pool service and the rapidly growing business of pool renovation as not to rely on new construction alone. I think these companies would indeed be very happy hovering around the 1 percent natural market.
There will be more recessions. There will even be the occasional bubble boom. But maybe next time, the excesses of the previous run-up will serve as a cautionary tale moving forward, as cooler heads put profits ahead of ill-considered exuberance. Let's hope, anyway.
The journey continues.
Bil Kennedy is president of Pkdata, an Atlanta research and consulting firm that has tracked the swimming pool and hot tub industry since 1992. The firm provides market guidance to leading pool and spa products manufacturers, retailers and builders in the U.S. and globally.


