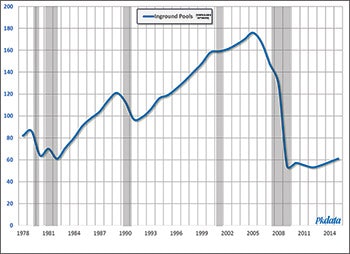
In 1991, the residential inground swimming pool industry began an impressive 14-year run-up, going from 97,000 annual new pools to 176,000. To put that in perspective, the 2.1 million inground pools built during that period nearly equaled the entire number of pools built in the U.S. since the industry's emergence in the 1950s. In fact, nearly 40 percent of all inground pools today were built during that period.
But as everyone knows, the party ended in 2006. Over the next four years total construction skidded from 167,000 in 2005 to 54,000 in 2009. That's a loss of nearly 70 percent.
 New residential inground pool construction (thousands of units) in the US, 1978-2015. Shaded areas represent recession periods. Source: Pkdata (Click to enlarge)
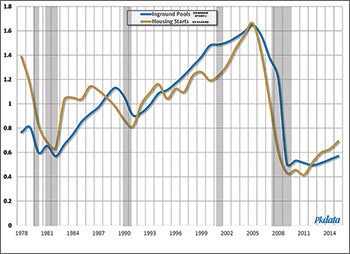
The decline was, of course, in response to the Great Recession, so pool builders weren't the only ones suffering. Housing starts nose-dived even more, recording a 74 percent drop during the same period. And since roughly 60 percent of all new pools were tied to the construction of a new home, it is not hard to see a connection. The only difference is that since the end of the recession, housing has mounted something of a comeback: According to the latest data from the Census Bureau, starts for single-family homes have risen by 61 percent.
Despite the resurgence in single-family home starts, pool construction has failed to see any meaningful improvement, going from 54,000 to only 61,000 today, a mere 13 percent over six years. The last time 61,000 inground residential swimming pools were constructed in this country was 1982, a year otherwise noteworthy for the release of the Commodore 64 8-bit home computer and the movie "E.T. the Extra-Terrestrial" … remember?
 Housing starts and new residential inground pool construction, 1978-2015. Values are indexed to facilitate comparison. Source: US Census Bureau; Pkdata (Click to enlarge)
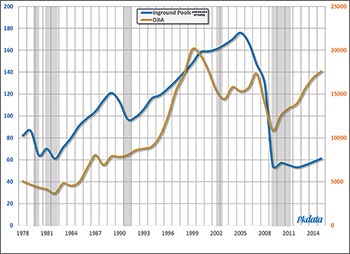
Since the recession the rest of the economy has done rather well. Not only has housing rebounded, but as of the end of February, unemployment was half of its 10 percent peak recorded in October 2009, while other indicators such as GDP growth and capital markets have greatly improved as well.
One example of an industry that has rebounded nicely is recreational vehicles, a segment to which the pool business is fond of comparing itself. According to data from the Recreation Vehicle Industry Association, RV shipments in the US are now up 125 percent since its own trough in 2009. Similarly, autos have increased 96 percent (Bureau of Economic Analysis) while cruise travel is up 54 percent (Cruise Lines International Association).
So why not pools? What do we make of an industry that has gone from rampant prosperity to rampant decline and then six years of stagnation?
 Comparison of the Dow Jones Industrial Average and new residential inground pool construction, 1978-2015. Source: Dow Jones & Company, as reported in The Wall Street Journal. (Click to enlarge)
It could be that the industry is simply "taking a breather" from the momentous change of the past decade. This does happen in other industries susceptible to boom and bust cycles. The automotive industry is a good example: Car production in this country went into a period of relative stagnation from 1957 to 1961 after the post-war boom had largely saturated the available demand. It entered a similar period in the early 1990s, following an eight-year cycle of growth and decline. If an industry produces a product that is still in demand, then it will usually return to a solid growth trajectory within three to five years. Otherwise it will languish, ultimately reaching something of a natural state. Industries that enter this phase are considered mature. They are characterized by a lack of innovation. Companies within these industries no longer invest in research and development. Moreover, marketing budgets are reduced. Cash flow becomes the imperative.
While this is not to suggest that the pool industry is in this category, it does beg the question: Is this the new normal?
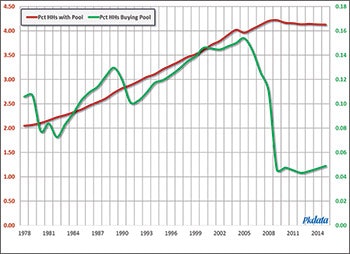
There are several ways to measure industry maturity. Perhaps the most appropriate in this case is to examine the degree of saturation of backyard pools (no pun intended). In the exhibit below we depict the percentage of U.S. households buying a new inground swimming pool in a given year versus the percent of households who already have one. Once again we see the eventual leveling out that began in 2010. As a consequence, the percentage of households with pools remained roughly the same. In fact, when we account for the number of pools now being removed from service we are getting close to where new pools are simply making up for the depletion rate — a scary thought for the aftermarket.
 Comparison of the percentage of households buying a new inground pool and the percentage of households already owning a pool, 1978-2015. (Click to enlarge)
So let's indulge ourselves in some simple math. Since 2010 the percentage of all U.S. households with an inground pool has been stuck at around 4.1 percent, and we want to test the notion that after some 40 years the industry has hit its limit.
First we estimate that the installed base of inground swimming pools in the U.S. is just over 5.1 million, which is 4.1 percent of 124 million, the total of all U.S. households according to the latest census numbers. But obviously not all households are capable of owning an inground pool. First we can eliminate anyone residing in multifamily housing, such as apartments and condominiums, of which there are about 45 million. That leaves us with 79 million single-family home dwellers. We can further eliminate those who do not meet certain socioeconomic criteria associated with the purchase of a new inground pool such as household income, age, employment status, etc. Also we can quickly remove existing pool owners including those with inground pools as well as so-called "permanent" aboveground pools, about 8 million households altogether.
This still leaves nearly 25 million households that have the right kind of home, who meet all of the criteria for pool purchase, and who do not already have a pool. But there's still one big hurdle: not all of them actually want a pool, a consideration that is left out of a lot of demand calculations.
Pkdata conducts numerous studies of pool consumers, both those who own a pool as well as prospective owners. In our most recent survey of pool prospects we asked, on a scale of one to five, how likely they would be to shop for a new inground pool within the next two years. A total of 13.4 percent responded "4" (generally likely) or "5" (very likely). Applying that percentage against a total potential market of about 25 million yields some 3.4 million households who have a relatively high interest in pool ownership. But how many of those will really buy a pool?
It turns out that the percentage who said "5" (very likely) was 3 percent, which represents about 750,000 households. So it is probably safe to say that the total latent demand for inground pools in the US is between 750,000 and 3.4 million. Let's go crazy for a moment and say that all of the 5's and half of the 4's will end up buying a pool (probably a little generous, but you can play this game too). That works out to a total demand of 2.1 million households. If they all bought an inground swimming pool, they would increase the installed base from 5.1 million to 7.2 million, meaning that existing pools constitute 71 percent of the total potential market.
Put in slightly different terms, since 1990 the average number of new inground pools is 116,000/year. At that rate we would completely meet available demand within the next 17-plus years.
In the end it doesn't really matter if latent demand is 750,000 or 3.4 million. The fact is that the qualified market is still less than the existing installed base. That wouldn't be so bad if this was a replenishment category like food or even cars. But once you have an inground pool in your backyard, you are unlikely to ever buy another.
What to do? It seems that the prescription is pretty clear. We'll never sell pools to people living in apartment complexes, or to families on fixed incomes or otherwise socioeconomically constrained. The only option is to increase desire among those in a position to own a pool today. That takes large doses of consumer marketing. But the potential return on investment is certainly there: 25 million untapped, qualified households is five times the existing stock of inground pools.
So after all is said and done, is inground pool construction a mature industry? You make the call.
Bil Kennedy is president of Pkdata, an Atlanta research firm that has tracked the swimming pool and hot tub industry since 1992. The firm provides market guidance to leading pool and spa products manufacturers, retailers and builders in the U.S. and globally.
Comments or thoughts on this article? Please e-mail [email protected].


